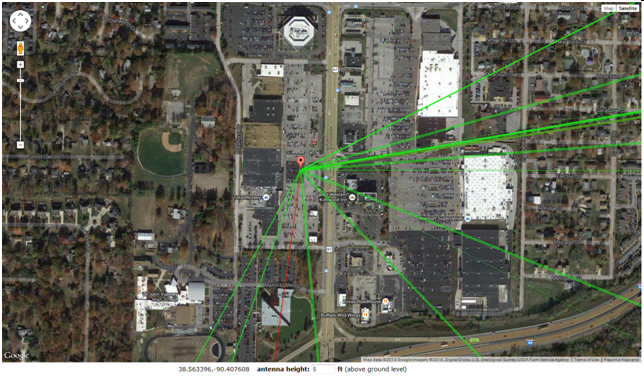
Note: I originally wrote this last fall for internal use, but it's relevant to a wider audience, so I'm posting it here also. This experiment took place in the St Louis, Missouri vicinity, the precise coordinates are included in the first photo. Sorry, but the conversion of the photos to jpegs for uploading to the site lost quite a bit of resolution of some of the finer details of the photos.
Early last spring, I stopped in Kirkwood at a location to take some signal readings of our local TV signals from a point where I could see a number of the local broadcast towers. The location was on South Lindberg (US Hwy 67), just north of I-44, in the parking lot of the Burlington Coat Factory store, across Lindberg Blvd from the Walmart Super Center.
Overhead view of parking spot.

I snapped a quick photo out my car window facing east. A number of the local TV station towers were visible as they were less than 5 miles away. I’ve highlighted the locations of the towers in the photo.

Reception forecast for test location, provided by TVFool.

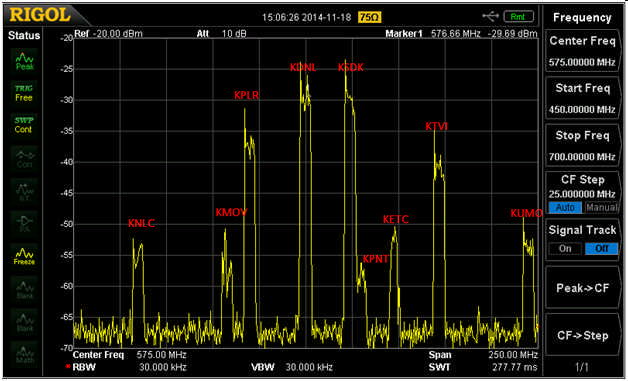
I set up the Rigol spectrum analyzer, running off a battery pack/inverter, to use a prototype of the Eclipse which was affixed to inside of the left rear car window so that the local signals could be viewed.

One thing immediately obvious is that KMOV’s million watt signal is nearly gone and shows evidence of severe multi-path (about 10 dB differential from min to max within the channel’s bandwidth and is down an estimated 20-30 dB from where it was expected to be. In fact, it’s displayed power level is about the same as a 2.0 kW channel 36 signal (KPNT) that transmits from KPLR’s tower. Looking at the photos on the first page of this report, it can be seen that the KMOV broadcast tower is directly behind the Best Western hotel next to the Chili’s restaurant. The building is six stories tall and is of concrete and steel construction.
Several additional observations:
1. TVFool calculated Rx signal powers for the top four stations on the list of between -11 and -15 dBm. Actual signal power measurements were substantially lower, in the neighborhood of -27 to -42 dBm with a difference of up to 25 dBm below the forecast levels, presumably because the main lobe of the broadcast signals was well overhead.
2. KMOV’s signal, when measured at the location behind the building, was some 40 dB below its forecast level.
3. Stations KNLC and KETC are visible, but their signal was coming from the edge of the antenna and on the other side of a shopping center building.
4. WBRU, operating on channel 47, is barely visible as a small bump in the noise between the signals for KTVI and KUMO-LD (which transmits from same tower as KPLR).
By the way, here’s what happens when a “fringe” area preamplifier gets installed.

It took about 16 dB of attenuation at the pre-amp’s input to cool off the intermodulation distortion that was visible above the analyzer's noise floor.
Edit 3/30/15:
Several notes:
1. The combination of bandwidth, MLP usage, and attenuator settings resulted in a displayed noise floor of only -65 to -70 dBm. It is possible that, with different settings, that the displayed noise floor might be pushed down (up to) another 20 dB. It is necessary to keep the signal level below -10 dBM at the Rigol's mixer input to avoid having it add its own internal IMD tot he display.
2. The majority of St Louis' FM stations transmit from those same towers as several of the TV stations. My test setup that day did not include any additional precautions, except using the UHF-only design of the Eclipse, to reduce signal powers below the displayed band. Therefore, there is a distinct possibility that FM broadcasts *might* have contributed to displayed images of distorted signals from some of the amps. My tests that day focused on the UHF band and harmonics up to 1.5 GHz. If I repeat any of those experiments in the future, I'll include FM signal levels as well as investigating the effect with FM attenuated, either with an external UVSJ or FM trap.

